Finding the cause of slow redis on a virtual machine

In our work, we often have to deal with very different configurations of the client’s server infrastructure. Today I would like to share my experience of finding the root cause of redis-cluster failures, which was very time consuming but could have been solved much faster. Perhaps our experience will save time for some beginner administrators in solving similar problems.
Problem statement
There are 3 servers in a local network with the following set of resources:
- 8 Intel® Xeon® E3-1270 v5 CPUs @ 3.60GHz
- 64 GB DDR3 RAM 1600MHz
- SSD 447 GB with /var/lib/redis partition
Each of them (two physical servers and one virtual machine) has 2 redis instances, a master and a replica. Read requests can be handled by either instance, write requests only by the master. The graphical representation of the configuration is shown below:

While working on one of the tasks was noticed incorrect infrastructural distribution of redis instances on the servers:
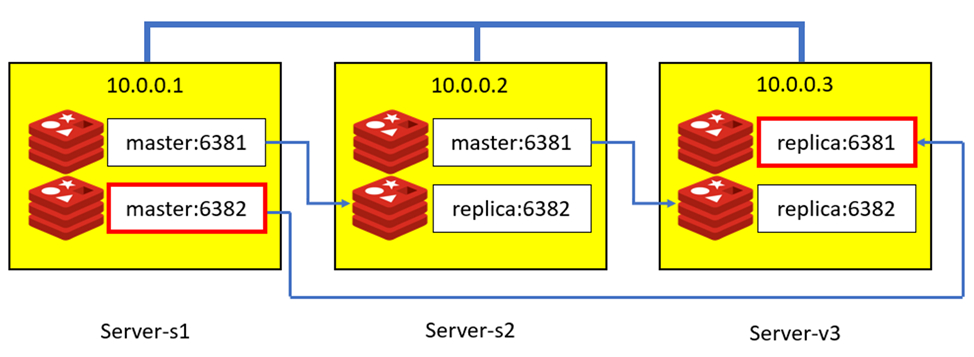
It was noticed that one of the master replica pairs had swapped places. To restore the given order, we did a manual failover and brought the cluster back to its original appearance.
And everything would have been fine unless every day after starting the cron at 1am the master on the server 10.0.0.3 moved to the server 10.0.0.1 again.
Master Log
# Connection with slave client id #123 lost.
# Failover auth denied to 10.0.0.1:6382 its master is up
# Configuration change detected. Reconfiguring myself as a replica of  10.0.0.1:6382
Replica Log
FAIL message received from 10.0.0.2:6381 about 10.0.0.3:6381
# Cluster state changed: fail
# Failover auth granted to 10.0.0.1:6382 for epoch 799
# Cluster state changed: ok Clear FAIL state for node 10.0.0.3:6381: master without slots is reachable again.
Marking node 10.0.0.3:6381 as failing (quorum reached).
Clear FAIL state for node 10.0.0.3:6381: slave is reachable again.
So, when you start the cron, data is written to the master, it becomes unavailable and the quorum kicks it out, then it appears on the radars again, but joins the cluster as a replica.
And restoring the order in the cluster is successful, until the next start of the cron, the master works as a master.
Finding the cause of cluster configuration failure.
Why does a cron job running on all servers, with the same configuration, take a long time on one server and cause no tangible problems on the others? Every time the order of masters and replicas was changed, only one master-replica pair was changed.
Resources? Could the 10.0.0.3 server have worse resources than the others? No. The configuration of the servers is identical, the virtual server has 10% less RAM, but it is not fully utilized.
Are there network issues? Perhaps there are networking issues between servers? No, there are no issues here, the performance is the same between all servers.
 # iperf -c 10.0.0.3
------------------------------------------------------------
Client connecting to 10.0.0.3, TCP port 5001
TCP window size: 85.0 KByte (default)
------------------------------------------------------------
[  3] local 10.0.0.2 port 47646 connected with 10.0.0.3 port 5001
[ ID] Interval       Transfer     Bandwidth
[  3]  0.0-10.0 sec  1.10 GBytes   946 Mbits/sec
Is there a problem with the drives? Perhaps writing or reading is taking longer? Reading on server 10.0.0.3 is really slow:
Server-s1# hdparm -Tt /dev/sda
/dev/sda:
 Timing cached reads:   33894 MB in  2.00 seconds = 16967.92 MB/sec
 Timing buffered disk reads: 538 MB in  3.00 seconds = 179.22 MB/sec
Server-v3# hdparm -Tt /dev/xvda5  /dev/xvda5:
 Timing cached reads:   7352 MB in  1.99 seconds = 3700.67 MB/sec
 Timing buffered disk reads: 186 MB in  3.00 seconds =  61.98 MB/sec
At this point the ideas ran out. The redis-benchmark results clearly show that on the server 10.0.0.3 redis is simply 8-10 times slower across all metrics.
Redis-benchmark on a physical machine:
# redis-benchmark -h 10.0.0.2 -p 6381 -q
PING_INLINE: 223214.28 requests per second
PING_BULK: 237529.69 requests per second
SET: 222717.16 requests per second
GET: 237529.69 requests per second
INCR: 227272.73 requests per second
LPUSH: 213219.61 requests per second
LPOP: 241545.89 requests per second
SADD: 234741.78 requests per second
SPOP: 225225.22 requests per second
LPUSH (needed to benchmark LRANGE): 218340.61 requests per second LRANGE_100 (first 100 elements): 242718.45 requests per second
LRANGE_300 (first 300 elements): 242718.45 requests per second
LRANGE_500 (first 450 elements): 230414.75 requests per second
LRANGE_600 (first 600 elements): 222222.23 requests per second
MSET (10 keys): 177304.97 requests per second
Redis-benchmark on a virtual machine:
# redis-benchmark -h 10.0.0.3 -p 6381 -q
PING_INLINE: 25542.79 requests per second
PING_BULK: 27434.84 requests per second
SET: 30797.66 requests per second
GET: 26673.78 requests per second
INCR: 31113.88 requests per second
LPUSH: 32133.68 requests per second
LPOP: 32331.07 requests per second
SADD: 29594.55 requests per second
SPOP: 30826.14 requests per second
LPUSH (needed to benchmark LRANGE): 30988.54 requests per second
LRANGE_100 (first 100 elements): 26413.10 requests per second
LRANGE_300 (first 300 elements): 27100.27 requests per second
LRANGE_500 (first 450 elements): 22706.63 requests per second
LRANGE_600 (first 600 elements): 29429.08 requests per second
MSET (10 keys): 23468.67 requests per second
Okay, maybe the deterioration is given by the reduced reading speed, which was defined above. But by a factor of 10? This moment, all the links on the first pages on google have already been checked several times. Suddenly, on the ObjectRocket page came across a mention that hypervisor may be to blame and worldly advice not to put redis on virtuals running Xen:
Probably the two most common operational choices which cause Redis to slow down is to 1) put it on a virtual machine – especially a Xen hypervisor based one and 2) heavy disk persistence.
So, what kind of hypervisor do we have on the virtual machine?
# virt-what xen xen-hvm
And it was only here that I discovered the documentation page, which explained that redis uses the fork operation to work.
Latency generated by fork In order to generate the RDB file in background, or to rewrite the Append Only File if AOF persistence is enabled, Redis has to fork background processes. The fork operation (running in the main thread) can induce latency by itself.
And the twist to the story is that under Xen, this operation slows down:
Fork time in different systems Modern hardware is pretty fast at copying the page table, but Xen is not. The problem with Xen is not virtualization-specific, but Xen-specific.
The developers even told Amazon users what instances can be used to avoid this problem.
For EC2 users, make sure you use HVM based modern EC2 instances, like m3.medium. Otherwise fork() is too slow.
Summary
In the analysis of the problem, which was identified by chance, had to go quite a long way. I will briefly outline the stages that had to pass in solving this problem:
- Confirming the recurrence of the problem described every 24 hours
- Verifying the need for a detailed analysis of the causes
- Analysis of a bank of related tasks on the project, where a lot of time was spent, but no solution was found.
- Comparison of available and used resources on three machines
- Eliminate networking problems
- Checking disk health and speed
- Analyzing redis-benchmark data
- A costly step to search for causes of this and similar problems in public sources
- A detailed review of documentation
Conclusions
Causes affecting the server speed can be numerous, when searching for them, do not forget to check the official documentation first, especially if it is well written. Perhaps there is not only already described in detail your problem, but also presented options for solving it.
You can find more our projects on Github page.